What is an MTF chart and how to understand it?
Ⅰ. What is MTF?
MTF stands for Modulation Transfer Function, which is an important indicator widely used to qualitatively and quantitatively express the performance of an optical imaging system. The MTF curve displays resolution and contrast information at the same time. It can also reflect the imaging quality of the imaging system in various frequency bands. It can evaluate the lens according to the needs of specific applications and can be used to compare the performance of multiple lenses. Usually professional lens manufacturers will use professional instruments to measure in an extremely objective and rigorous test environment, which is an authoritative and objective technical reference for lens imaging quality.
To ensure the accuracy and scientificity of the measurement data, Thypoch brand MTF data comes from the company's equipment TRIOPTICS ImageMaster HR series products. As of 2024, this equipment will still be the top measuring instrument in the industry.
--What can the MTF curve tell you?
- Image surface (frame) size
- Resolution
- Contrast
- Lateral chromatic aberration
- Out-of-focus condition
--What can’t the MTF curve tell you?
- Glare
- Distortion
- Longitudinal chromatic aberration
- Color restoration
*This refers to the lens quality that we can and cannot see in the MTF curve published by the manufacturer. It is not data that cannot be detected by the manufacturer.
Ⅱ. How to analyze the MTF chart?
- First, we need to understand the meaning of the X-Axis and the Y-axis:
The X-Axis represents spatial frequency, usually expressed in line pairs per millimeter (lp/mm), which represents the size of detail in the image. For example, the curve in the figure below is the range of the X-axis from 0-22, which represents the range from the center of the measured image to the corners. 0 represents the center of the picture, 22 represents the edge of the picture, and 22 is the radius of the imaging element. Here we can also know that the imaging diameter of the lens under test is 44mm, which can cover the full-frame sensor.
Note: Spatial frequency: It means that several identical geometric structures appear per unit length. Used to describe the level of detail or degree of variation in an image. The higher the spatial frequency, the smaller the details in the image, and the lower the frequency, the larger the details in the image.

The Y-Axis represents the contrast transmission, usually expressed as a percentage between 0 and 1. It represents the degree to which the lens maintains the clarity and contrast of details. The higher the percentage, the stronger the resolution of the lens.
Note:
Resolution - the ability to reproduce fine details;
Contrast – The ability to distinguish between dark and light levels.
- Secondly, we need to understand the parameters below the MTF curve

Before talking about parameters, let’s understand the line pairs.
Line Pairs (LP): To put it bluntly, it is a pair of lines, usually as shown below:
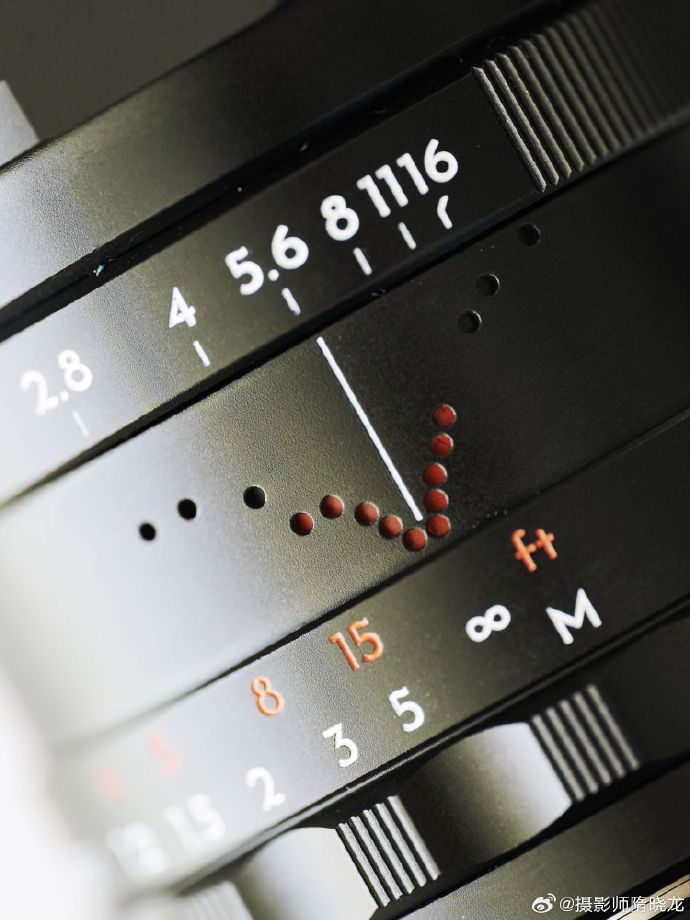
The logo in the lower right corner of the picture above is T for tangential, which represents the meridional direction (tangential direction), and S for sagittal, which represents the sagittal direction (radial direction), two line pairs in different directions.

When the two lines in the MTF curve are closer, it means that the lens imaging is more scientific, and the lateral chromatic aberration TCA (astigmatism) will be smaller; when the distance between T and S is farther, it means that when approaching the edge of the lens, the image chromatic aberration (astigmatism) varies in all directions. Think of it this way, if your image is a bit blurry, scientifically speaking, the degree of blur is the same in all directions; but the often-called characteristic out-of-focus is precisely caused by the different degrees of blur in different directions. This is also why bokeh can be so magic.
10 represents 10 line pairs within 1 mm; 30 represents 30 line pairs within 1 mm, which is more dense. The closer the 10 lines/mm curve in the figure is to 1 (maximum value), the better the imaging contrast of the lens. The closer the 30 lines/mm curve is to 1, the higher the resolution of the lens.
F corresponds to the aperture value we are familiar with. Generally, the image quality of a lens at the maximum aperture is not optimal, so manufacturers usually provide two different values for reference, such as F/1.4 and F/5.6.
Here we can briefly summarize the MTF curve viewing method
- The higher any line is on the Y-axis, the better the contrast and resolution will be;
- The gentler the downward trend of any line, the smaller the gap between the imaging center and the imaging edge;
- The closer the dotted line is to the solid line, the more scientific the lens’s out-of-focus and less stylish it will be;
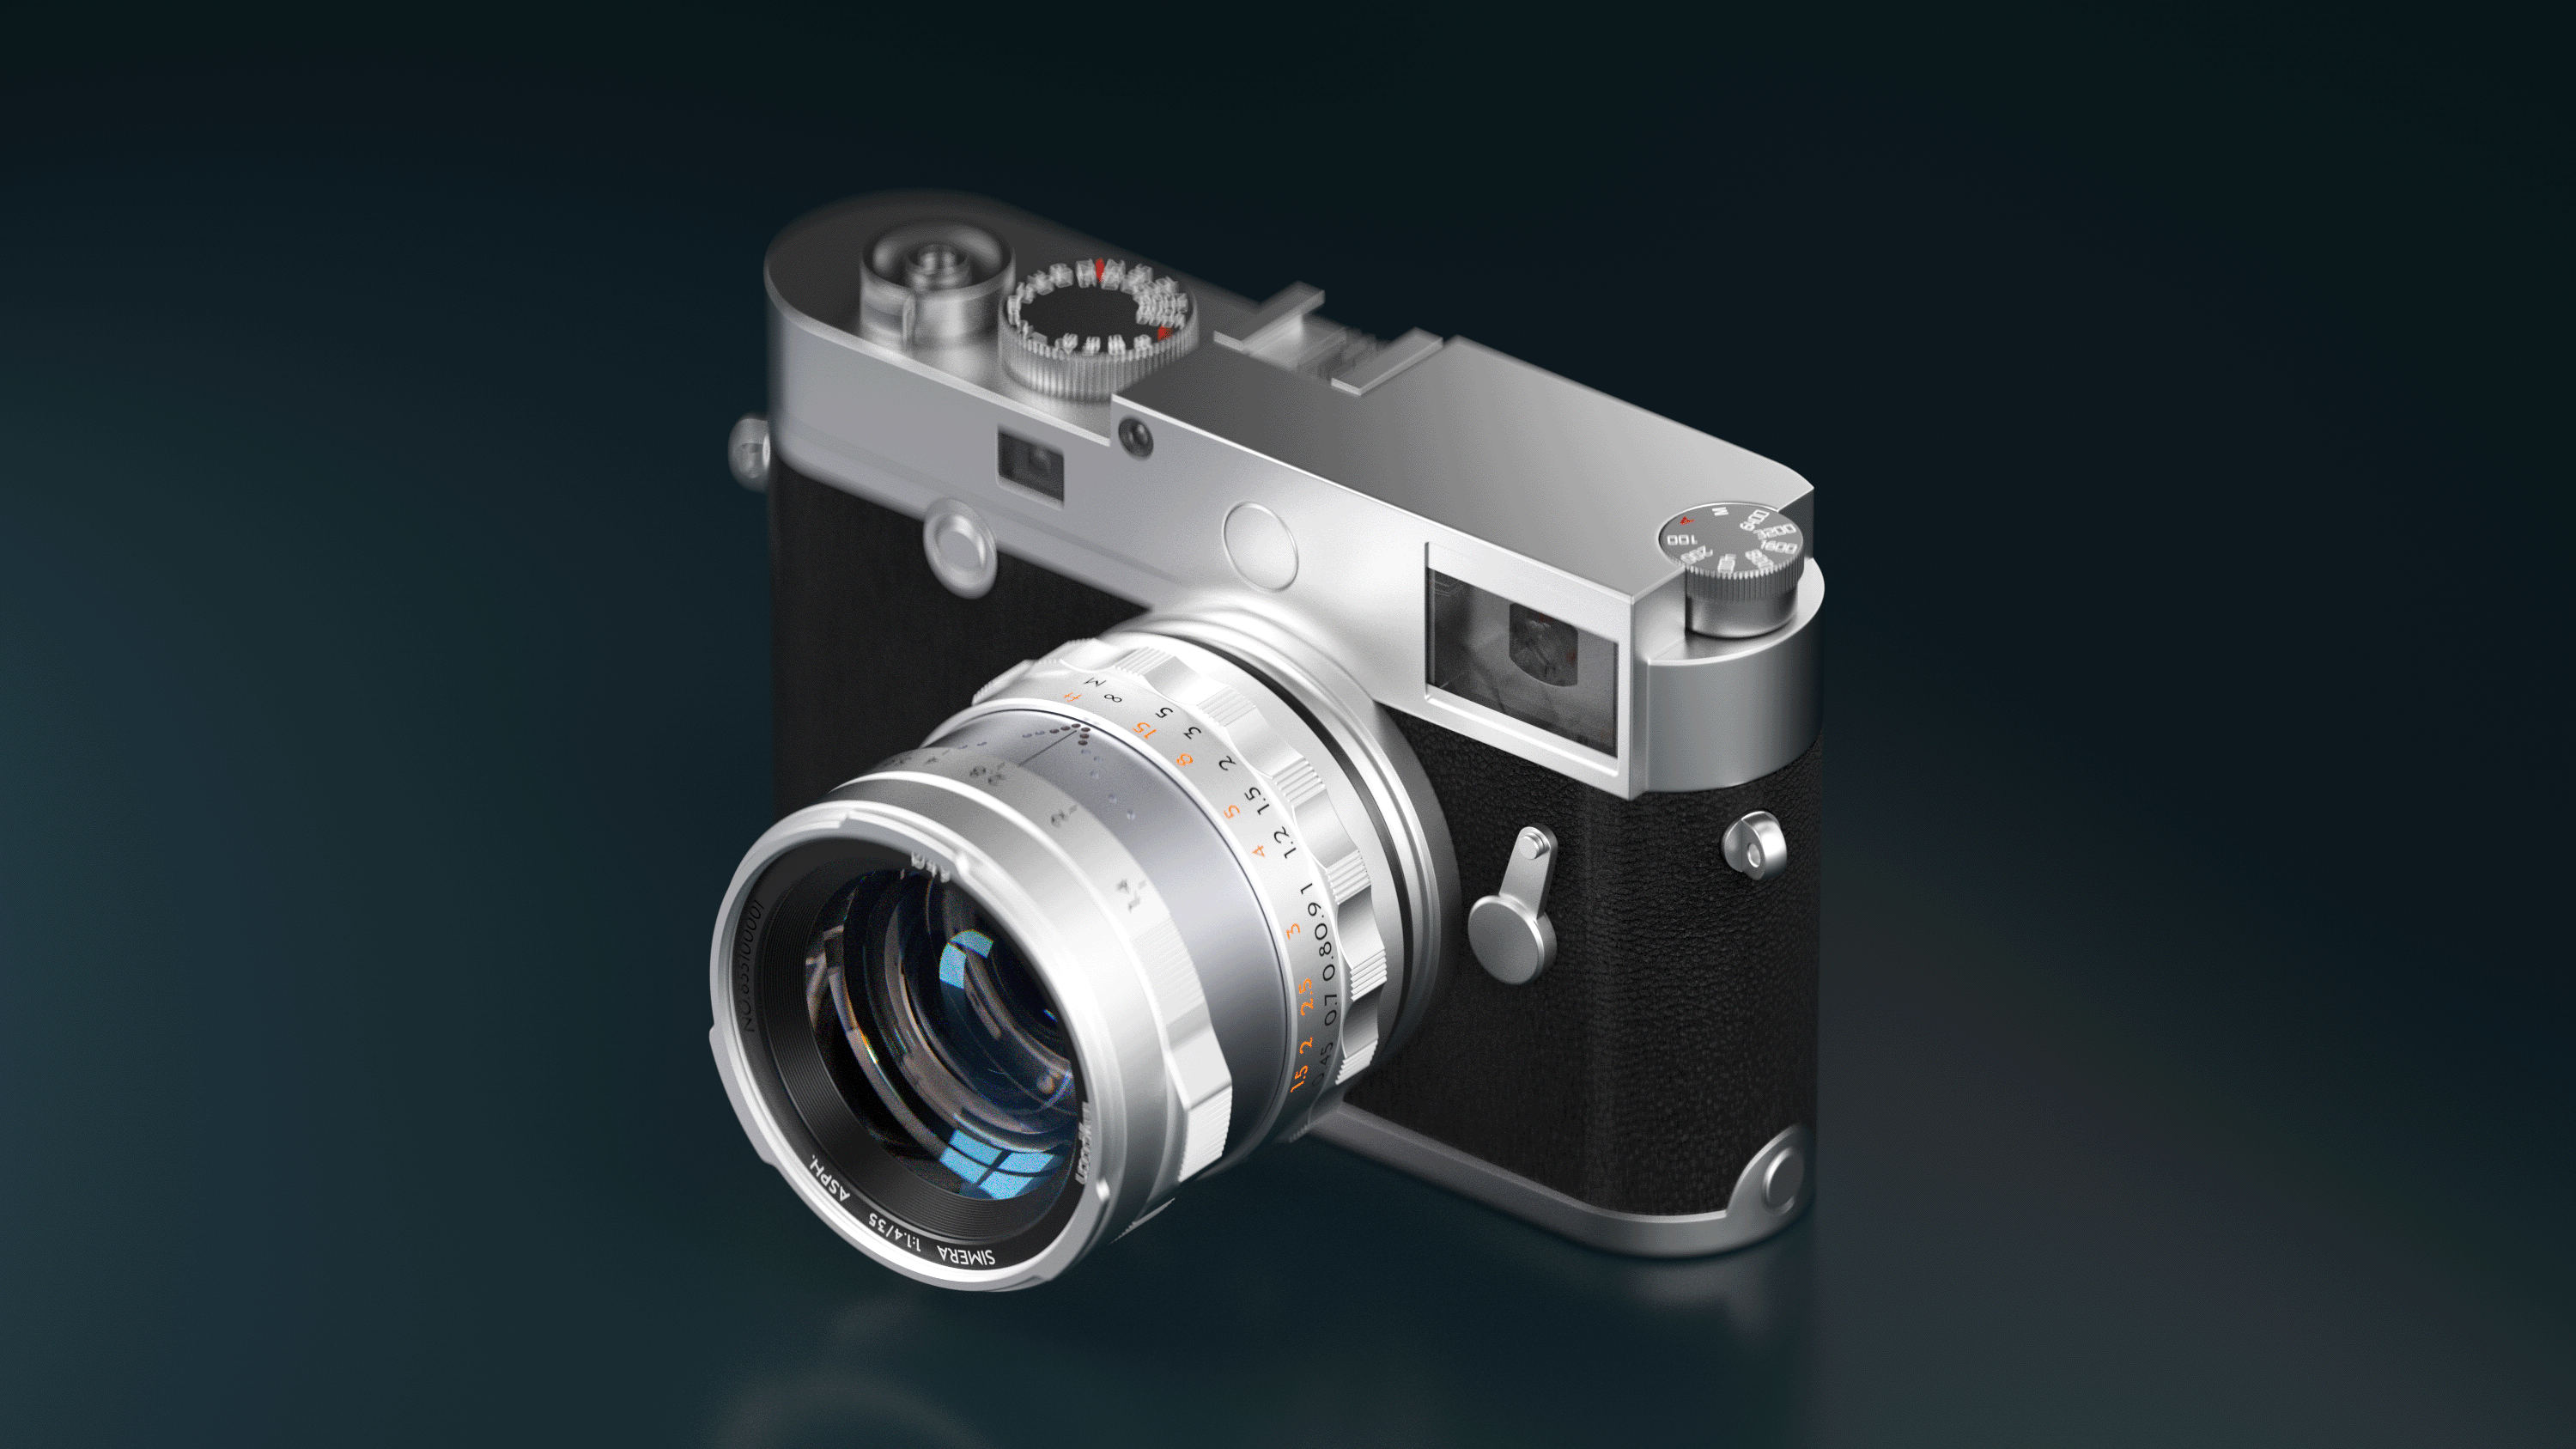
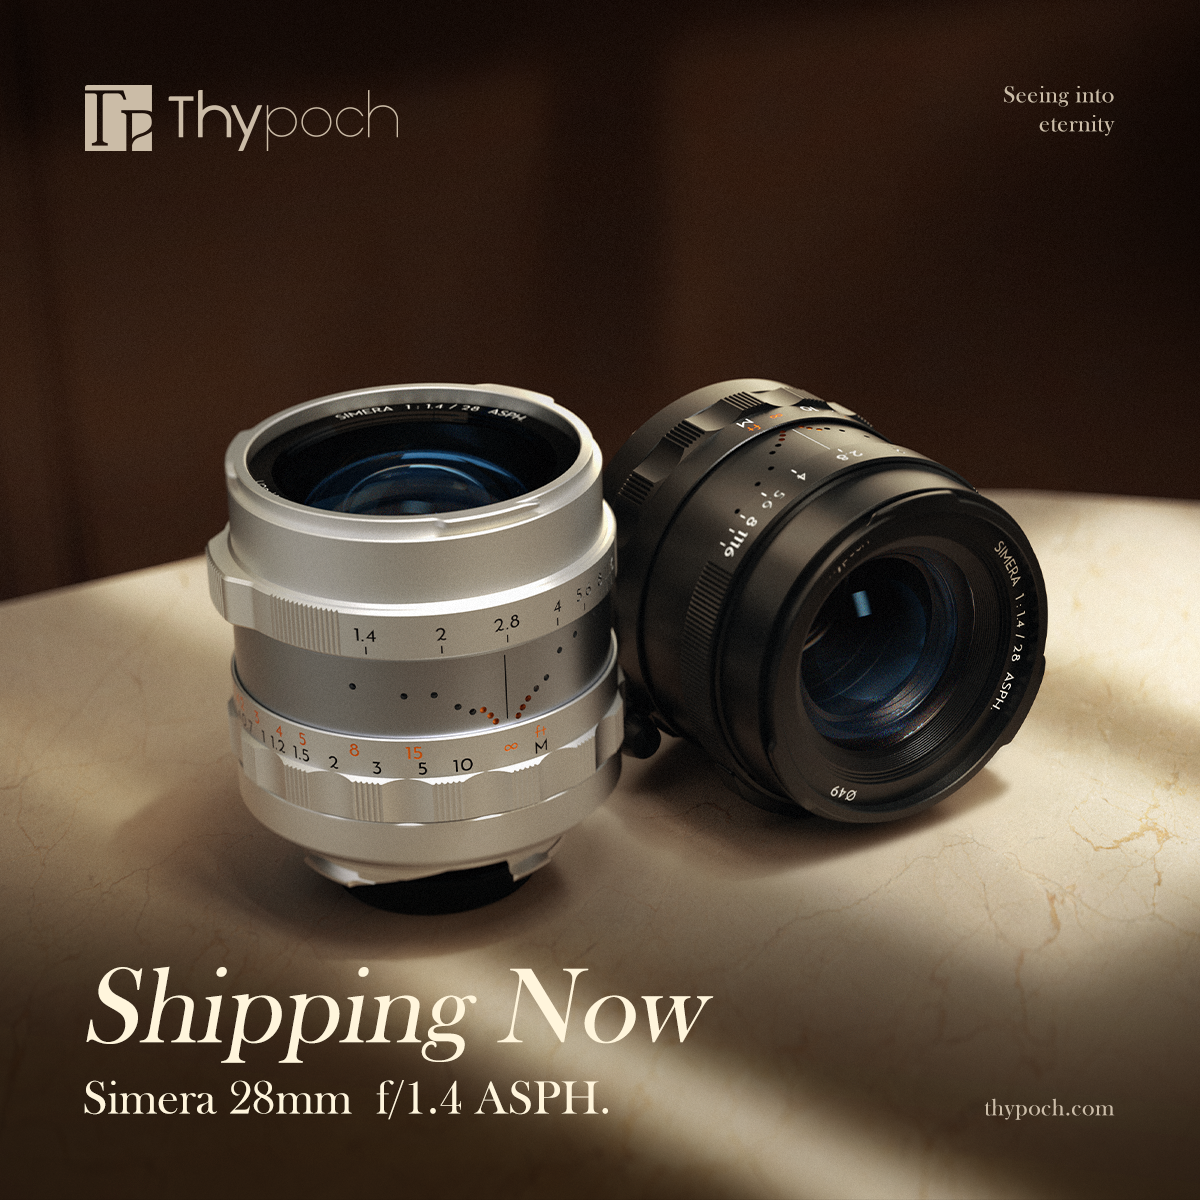
Analyzing the imaging quality of Simera 35mm & 28mm f/1.4 through MTF charts:

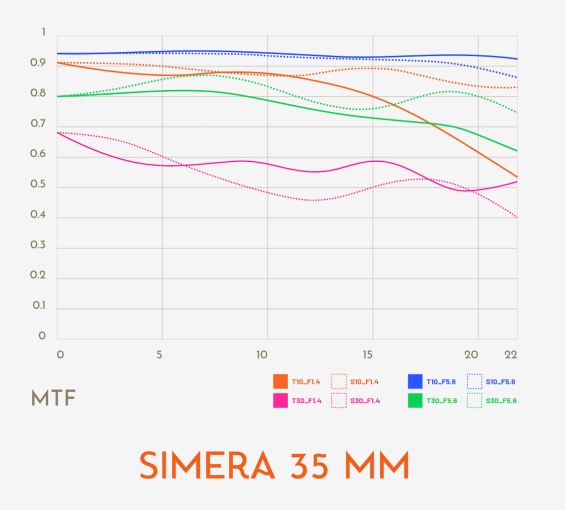
It can be seen that at the spatial frequency of 10 lines/mm, whether it is the full aperture F1.4 or the optimal aperture F5.6, the Simera 28mm f/1.4 performs well from the center of the image to the edge is optimal, very close to 1. The contrast performance is excellent, the dotted line and the solid line are very close, and the out-of-focus performance will be more scientific.
Regarding the Simera 28mm f/1.4, at the spatial frequency of 30 lines/mm, you can see that the optimal part is in the center of the picture, gradually showing a downward trend toward the edges, and the lens resolution will also decrease slightly from the center to the edges. When the aperture shrinks to f/5.6, The resolution at the edges will be improved compared to the performance at full aperture f/1.4.
The MTF chart can give us a first impression of the sharpness of the lens. For photography, it only gives us an impression that can be roughly called "quality". Our preferred imaging effect and style has no specific definition or unit of measurement. It consists of more than just sharpness. Vignetting, flare, color reproduction and distortion all contribute to the overall style of a lens. Whether a lens is right for you doesn't just depend on what you see on the MTF chart, it's also important to consider other factors, which often have to be discovered by actual shooting samples.


.jpeg)


.jpg)
.png)
.png)

.png)